10 Console tricks, to debug like a Pro.
Okay, I know it’s kinda like a click-bait title, but trust me you’ll be surprised by what console can do. let’s start with some basic ones.
1. console.group(‘name’) and console.groupEnd(‘name’)
As the name suggests it will group multiple logs in one single expandable group, you can even nest them if you’d like to further group them. console.group(‘groupName’) starts the group and console.groupEnd(‘groupName’) closes a group. There is a third function console.groupCollapsed which creates the group in collapsed mode.
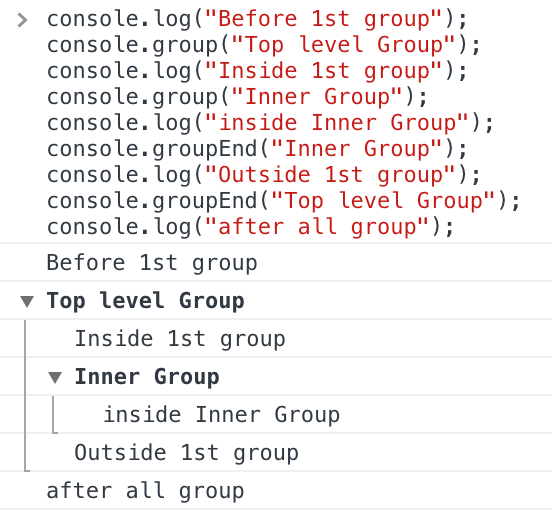
console.group Demo
2. console.trace()
When you need to find the whole call stack of a function, console.trace is super useful, I use this mostly to find from where callback is passed, it will print the whole stack-trace. Let’s take an example:
function foo() {
function bar() {
console.trace();
}
bar();
}
foo();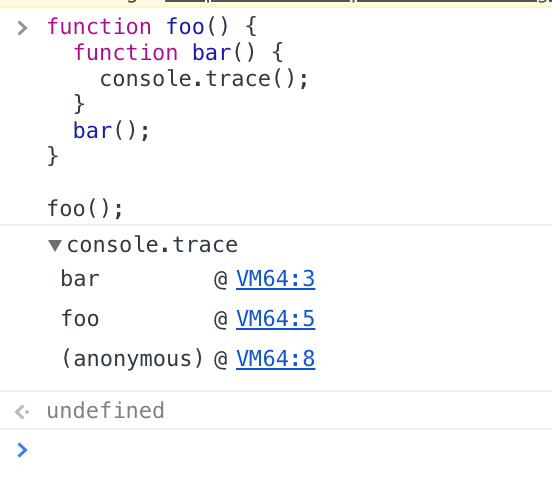 The output of console.trace()
3. console.count(“counter: ”)
I use this so much, mostly to find how many times a component is rendered in react. As you can guess this will log the total count of the number of times it was executed. Remember if you change the string which is logged, it will start a new counter for that string, we also have a handy function to reset the counter: console.countReset(‘Counter’), the name should match though.
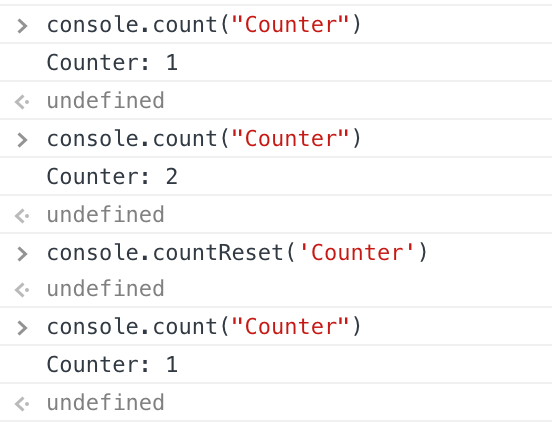 the output of console.count and console.countReset
4. console.time() and console.timeEnd()
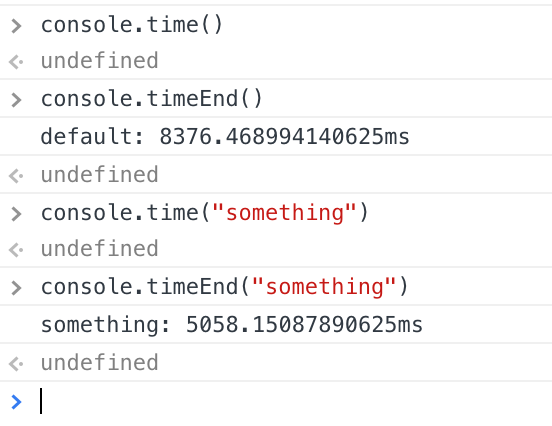
console.time() will start a timer and will end it once timeEnd() is called, they are mostly used when you need to do performance check. You can also pass a string to time and timeEnd and it will start another timer of that name.
5. console.assert()
So let’s say you need to check if some expression/value ever becomes false, and when it does you want it to be logged, now you would normally wrap this is an if-else, but no need to do that console.assert does the job for you, you need to pass the condition first and message/object as 2nd param. Let’s check the following example
function greaterThan(a, b) {
  console.assert(a > b, { message: "a is not greater than b", a: a, b: b });
}
greaterThan(2, 1);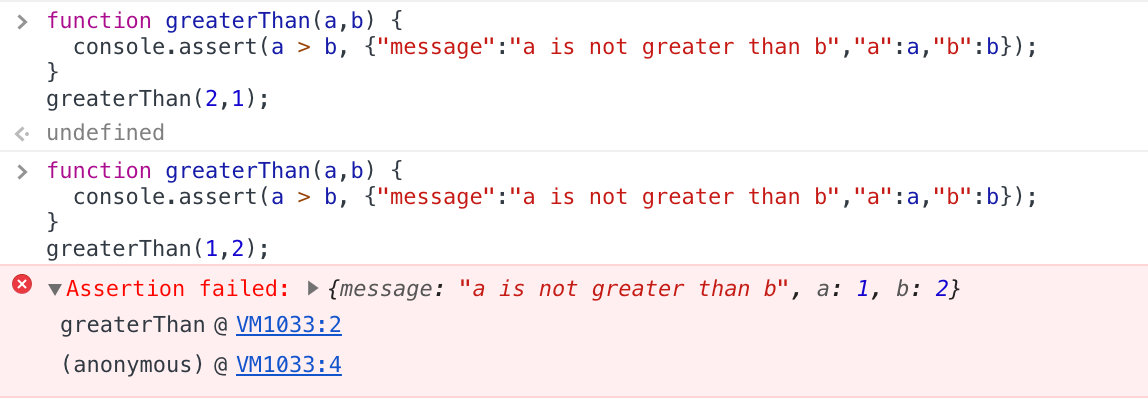
6. console.profile([label])
How many times have you wished if you could start profiling when it is needed instead of keeping it on from start and then manually finding the point which you needed to profile. Well, console.profile() comes to rescue. when you are done profiling just call console.profileEnd(), let’s take an example:
function thisNeedsToBeProfiled() {
  console.profile("thisNeedsToBeProfiled()");
  // later, after doing some stuff
  console.profileEnd();
}
this will log and add in profiles panel.
7. console.timeStamp([label])
Adds an event to the Timeline during a recording session. I use this to mark places where the API call returned and when was the data processed, there are many use cases for this though.
console.timeStamp("custom timestamp!");8. console.clear()
This is pretty clear(pun intended), it clears the console, nothing much here.
9. console.memory
This is not a function, but a property which stores your HeapSize, when perf is tricky and graphs are hard to read, simply logging the memory might help.
 console.memory output
10. console.table(array)
This is my fav. and best trick, it prints a slick table, with which you can interact, you need to pass an array of object to it.
 console.table’s output
Go ahead and try some of these, let me know about your debugging hacks.
Don't forget to share this and subscribe to the newsletter, I write about improving in Javascript, trying new concepts from different languages etc. Mostly ReasonMl, elixir, and everything functional ;)
Cross posted on Medium. Give it some claps (👏)x50 there.